


A forex chart pattern can simply be defined as a visual representation of real-time movements of prices over a certain timeframe. All currency pair prices are displayed using the Cartesian coordinate system with the X- and Y-axis, with the vertical axis showing the time and the vertical axis indicating the price.


In terms of importance, chart patterns form a fundamental part of technical analysis that traders do that will direct their trading decisions.
Learning to read chart patterns may seem confusing at first, and beginner traders are urged to start with one pattern and to become familiar with it first before they move on to the next pattern. This is because there are many different patterns, and traders can easily get overwhelmed by the amount of information available.
The convenience involved with being able to use chart patterns means that traders can conduct effective technical analysis and ensure that they make improved trading decisions.
Chart patterns form an integral part of trading systems or trading strategies, and traders must ensure that they test these strategies in a safe trading environment before they apply them where their capital is at risk.
While many trading strategies can contain multiple different chart patterns that work together to identify certain trends and ideal entry points where traders can place their trades, there are many chart patterns such as Ichimoku Cloud, which is an entire system on its own.
Traders are always urged to ensure that they use the right chart patterns for the financial instruments and market conditions that they intend to trade to ensure that they can clearly define their entry and exit points.
- Head and Shoulders (H&S)
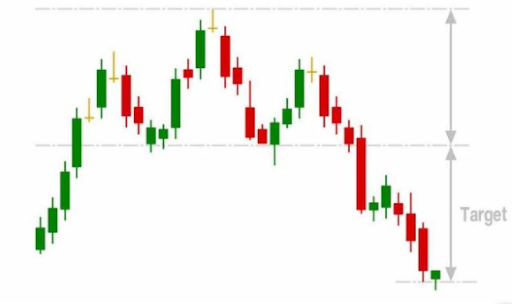
This is a chart pattern that appears in most time frames on all currency pairs, and it has entry levels, stop levels, and price targets that make it easy for traders to develop a trading strategy.
The head and shoulders chart pattern is formed as follows:
- The left shoulder is the price rise which is followed by a left price peak and followed by a decline.
- The head – is the price that rises again to form a higher peak than the left shoulder.
- The right shoulder forms when there is another decline followed by a rise which forms the right peak and which is lower than the head.
(Image source: https://admiralmarkets.com/education/articles/forex-analysis/most-frequently-used-forex-chart-patterns)
The inverse head and shoulders pattern works on the same principle but is inverse or upside down.
With this chart pattern, traders must wait for the pattern to complete after they have set a neck- or trendline which connects two highs in a bottoming pattern or two lows that are present in the topping pattern of the formation.
The most common entry point when using this charting pattern is a breakout of the neckline, and traders must set their stop-loss above or below the right shoulder, deepening on whether the pattern is a regular H&S or inversed.
In terms of the profit target, for a regular head and shoulders chart pattern, traders must establish the difference between the high of the head and the lowest point in both shoulders.
Traders can then subtract this figure from their entry price, and they will have their profit target. With an inverse head and shoulders, traders take the low of the head and subtract it from the high of the shoulders. The result must then be added to the breakout price.
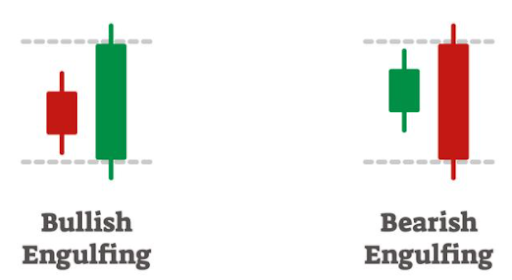
2.Engulfing Pattern
Forex candlestick charts are inherently known for providing a lot more information than simple line charts, and for this reason, forex chart patterns are a useful tool when traders want to measure price moves across all timeframes.
As there are many forex chart patterns, traders are urged to pay attention to the following chart pattern as it is easier to spot using candlestick charts.
The engulfing pattern presents an excellent trading opportunity, and it is simple to identify, with price action indicating a powerful and instant change in direction.
When there is a downtrend, an up candle real body will engulf the preceding down candle's real body, also known as a bullish engulfing pattern. If there is an upwards trend, the down candle's real body will engulf that of the previous up candle, indicating a bearish engulfing pattern.
(Image source: https://admiralmarkets.com/education/articles/forex-analysis/most-frequently-used-forex-chart-patterns)
(Image source: https://www.investopedia.com/articles/forex/11/most-used-forex-patterns.asp )
This chart pattern is one of the most tradable patterns because of the price action indicating a strong reversal because the prior candle has already been reversed completely.
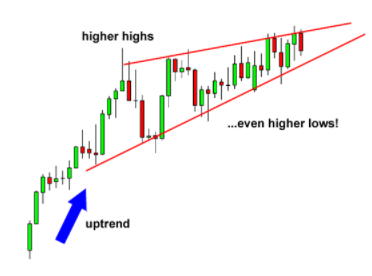
3.Rising Wedge
The rising wedge also referred to as the ascending wedge, is a powerful consolidation price pattern that is formed when prices are bound between two rising trendlines. The rising wedge is considered a bearish chart formation that could indicate both reversals as well as continuation patterns, depending on both the location and the trend bias.
This is a popular reversal pattern that is very predictive and can provide forex traders with clues to the direction and the distance of the next price move that can occur.
Rising wedges typically appear regularly in the forex market, and many traders use them because it is simple and features easy identification and application.
The rising wedge pattern can simply be interpreted as a bearish continuation and bearish reversal, giving rise to some confusion on how to identify the pattern. However, both these scenarios have a different set of observation dynamics that set them apart.
In terms of a continuation pattern:
- Establish downtrend
- Rising wedge consolidation will form.
- This will link highs and lower lows through a trend line assembling towards a narrowing point.
- Divergence can be confirmed between the price and the volume, using the Moving Average Convergence Divergence (MACD) or any other volume function.
- The overbought signal can be confirmed using other indicators such as oscillators.
- Traders can now look for a break below support for a short entry.
In terms of the reversal pattern:
- Establish uptrend
- Rising wedge consolidation will form.
- This will link highs and lower lows through a trend line assembling towards a narrowing point.
- Divergence can be confirmed between the price and the volume, using the Moving Average Convergence Divergence (MACD) or any other volume function.
- The overbought signal can be confirmed using other indicators such as oscillators.
- Traders can look for a break below support for a short entry.
(Image source: https://www.babypips.com/learn/forex/wedges)
4.Triangles
Triangle forex patterns consist of two of the following trendlines: flat, ascending, or descending, and if the price of a forex pair bounces between these trendlines, it will eventually breakout.
There are three types of triangle forex patterns to consider:
- Symmetrical Triangle
- Ascending Triangle
- Descending Triangle
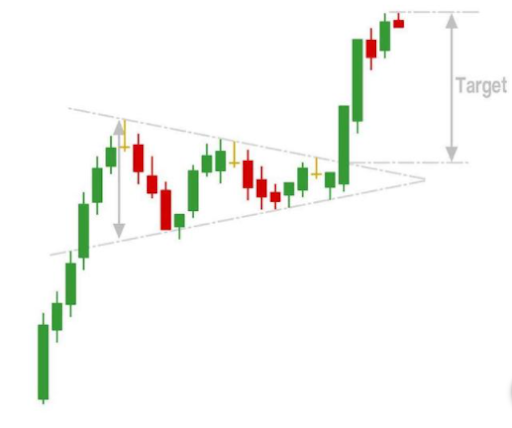
Symmetrical Triangle
The symmetrical triangle is typically considered as a continuation forex chart pattern. This pattern signals a period of market consolidation, which is often followed by the resumption of a preceding trend. The symmetrical triangle, as indicated below, is formed by a descending resistance line and a support line that is ascending.
(Image source: https://admiralmarkets.com/education/articles/forex-analysis/most-frequently-used-forex-chart-patterns)
The two trendlines that are in this formation must have a slope that converges at a specific point, commonly known as the apex. The price of the currency pair will bounce between these lines toward the apex. Once the price reaches the apex, the price will break out in the direction of the foregoing trend.
If there is a preceding downward trend, the trader must concentrate on a break below the ascending support line. However, if it is preceded by an upward trend, traders must look for a break located above the descending resistance line.
Traders must note that this forex chart pattern favors a continuation of previous trends, but this is not always the case.
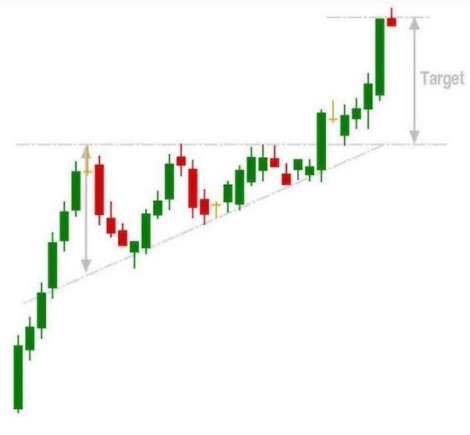
Ascending Triangle
The ascending triangle is known as a bullish forex chart pattern that offers some indication that the forex price is heading higher. The ascending triangle is formed by two different trendlines, namely a flat trendline, which is the point of resistance, and an ascending trendline, which is the role of price support.
If the price of a currency pair moves between these lines until it breaks out, it will occur upwards through the line of resistance. The ascending triangle is typically preceded by an upward trend, which makes it a continuation forex chart pattern.
(Image Source: https://admiralmarkets.com/education/articles/forex-analysis/most-frequently-used-forex-chart-patterns)
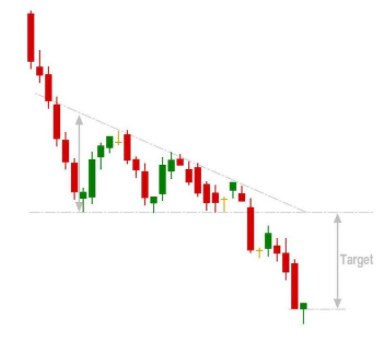
Descending Triangle
This forex chart pattern is the opposite of the ascending triangle pattern, and it is known to provide a bearish signal to forex traders. This informs traders that the price will trend upwards once the pattern is completed.
The descending triangle consists of a flat line of support along with a downward-sloping line of resistance. Much as with the ascending triangle, the descending triangle is considered a continuation chart pattern because it is preceded by a downward trend.
Traders must note that this is not an exact science and that these triangle patterns will not always indicate that the price is about to break out in the expected direction.
(Image source: https://admiralmarkets.com/education/articles/forex-analysis/most-frequently-used-forex-chart-patterns)
5.Ichimoku
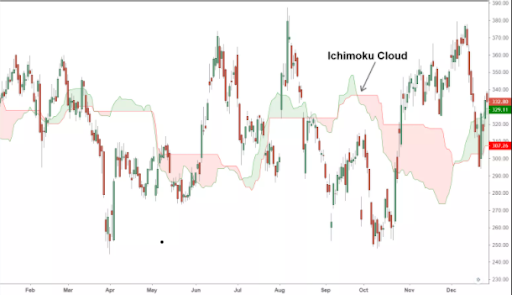
The Ichimoku Cloud is known to host a collection of different technical indicators that show both support and resistance levels as well as momentum and trend direction.
This is done by taking several averages and plotting them on a chart, and by doing this, the Ichimoku uses figures to compute a “cloud,” which attempts to forecast where the price of a forex pair may find support or resistance in the future.
Ichimoku is known to provide more data points than a typical candlestick chart, and while it seems very complicated at first, traders who are familiar with how charts are read will find it easy to understand.
To calculate the Ichimoku cloud, traders can follow these steps:
- Calculate the Conversion and the Base Line.
- Next, traders can calculate Leading Span A based on previous calculations. Once this is calculated, the data point is plotted 26 periods into the future.
- Next, traders must calculate Leading Span B and plot the data point 26 periods into the future.
- To calculate the Lagging Span, traders can plot the closing price 26 periods into the past on the forex chart.
- The difference between Leading Span A and Leading Span B will subsequently be colored in to create the cloud.
- Once Leading Span A is above Leading Span B, the cloud must be colored green. Once Leading Span A is below Leading Span B, traders must color the cloud red.
- When traders follow the steps above, they will create one data point. To create the lines, with each period ending, traders must go through the steps again to create new data points for the period. Traders can connect the data points to create lines and the appearance of the cloud.
(Image source: https://www.investopedia.com/terms/i/ichimoku-cloud.asp)
The Ichimoku Cloud shows traders relevant information immediately by using averages. The overall trend is up when the price appears above the cloud and down when the price is positioned below the cloud. There is no trend present when the price is within the cloud.
If Leading Span A is rising, and it is above Leading Span B, it helps traders confirm the uptrend, and the space between the lines will be colored green. If Leading Span A is falling below Leading Span B, traders can confirm the downtrend, with the lines colored red.
Traders typically use the Ichimoku Cloud as an area of support and resistance, depending on where the price of the currency pair is. The cloud provides both support and resistance levels which can be projected into the future, setting Ichimoku apart from many other technical indicators, as these only provide support and resistance for a current date as well as time.
To maximize their risk-adjusted returns, traders are urged to use the Ichimoku pattern alongside other technical indicators, for instance, with the Relative Strength Index (RSI), which can be used to confirm whether there is momentum in a certain direction.
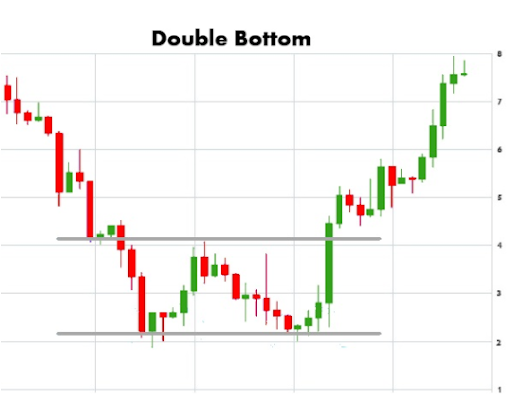
6.Double Bottom
A double bottom can be defined as a technical analysis charting pattern that indicates a change in the trend and momentum reversal from previous leading price action. It can indicate the drop of a currency pair, a rebound, another drop to the same or a similar level as the original drop, and finally another rebound.
The double bottom looks like a “W,” and the twice-touched low is considered a support level.
Many technical analysts believe that the advance of the first bottom must be a drop of 10 to 20% and that the second bottom should form within the 3 to 4% of a previous low, with the volume on the ensuing advance increasing subsequently.
Where most chart patterns are concerned, a double bottom pattern is best when it is used to analyze intermediate and long-term views of the financial market. The longer the duration between the two lows in the chart pattern, the greater the probability is that the pattern will be successful.
(image source: https://www.trade.education/5-stock-chart-patterns-help-maximize-profits/)
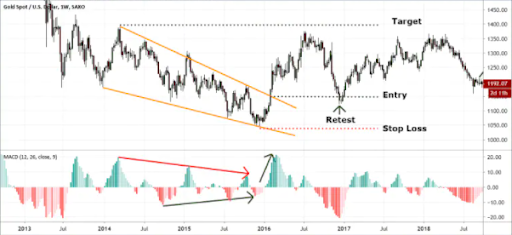
7.Falling Wedge
A falling wedge chart pattern is inherently known for signaling a bullish reversal after either a downtrend or a trend continuation is identified when there is an established uptrend.
The falling wedge pattern is defined by a set of lower lows, or support, as well as lower highs, or resistance, which slopes downwards to contract into a narrow range before the price breaks above the resistance line, leading to a change in the direction of the trend.
Another notable characteristic that the falling wedge has is that the upper resistance line typically has a steeper descending angle than that of the lower support line.
(Image source: https://www.asktraders.com/learn-to-trade/technical-analysis/falling-wedge/)
When aggressive forex traders use the falling hedge chart pattern, they usually wait for the price to break above the higher resistance line before they execute their long (buy) position. In contrast, more conservative traders will typically wait for the price to retest the higher resistance line from above before they enter a long position.
The ideal place to place a target will be in the upper level where the falling wedge pattern started, with a stop-loss placed a few pips below the last low before the breakout is set to occur.
When following the falling wedge chart pattern in real-time, traders are urged to watch for a momentum divergence by using a MACD Histogram that is present between the lower lows. Traders can use this as an additional confirmation method to indicate that a falling wedge might be ending.
Once this pattern ends, there is often an increase in the momentum once the price has broken above the resistance line.
8.Bearish Rectangle
A bearish rectangle is a continuation chart pattern that happens when a price pauses while there is a strong downtrend. The price then bounces between two parallel levels before the trend continues in the same direction.
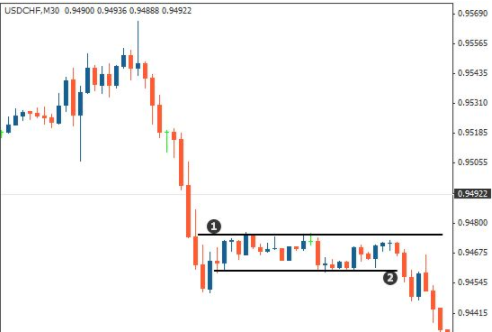
(Image source: https://learn.tradimo.com/advanced-chart-patterns/bearish-rectangle)
To identify a bearish triangle, traders can refer to the image provided above. Here, the price falls during a strong downtrend and then starts to consolidate between the support (1) and resistance (2) levels.
The price continues to move sideways as it bounces between these parallel lines and subsequently forms a box-type, rectangular shape that has earned the chart pattern its name.
To trade the bearish rectangle pattern, traders can follow some of the following methods.
Method 1:
- Traders can enter a short position when once a candlestick has closed below the lower parallel line of the rectangle or support level.
- Traders can place their stop-loss order above the upper parallel line of the rectangle, above the resistance line.
- Next, traders can measure the height of the rectangle and proceed to place their take profit order at the same distance under the lower parallel line of the rectangle.
Method 2:
- Traders can wait for the candlestick to close below the support level and wait for the price to retest the lower line. This broken support level will turn into a resistance level and allow the trader to place their short position.
- Traders can place their stop loss above the old support level, which has turned into resistance.
- Traders can proceed by measuring the height of the rectangle and placing their take profit the same distance below the lower parallel line of the rectangle.
9.Bullish Rectangle
A bullish rectangle chart pattern in forex trading is a bullish continuation pattern that forms during an uptrend and defines horizontal levels of both support and resistance.
The bullish rectangle indicates equal strength present between both buyers and sellers in the market, and it indicates that the price of a forex pair is likely to continue its initial trend direction once the pause is complete.
Bullish rectangle chart patterns are typically seen once a sharp rally of prices occurs in an upwards trend.
Traders can consult the image below to see what a bullish rectangle looks like on a candlestick chart on USD/JPY.
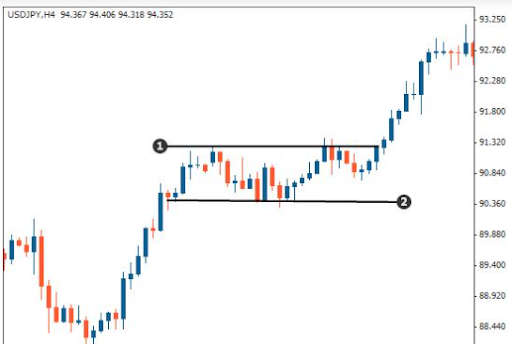
(Image source: https://learn.tradimo.com/advanced-chart-patterns/bullish-rectangle)
When considering the visual example above, traders can easily see that the price remained between two key levels that are parallel to one another, the support and resistance levels. When there is a breakout on the resistance line, it signals a probable continuation of the trend after the price has consolidated.
When trading using the bullish rectangle chart pattern, the price could break out on either side, and for this reason, traders must wait for the breakout as confirmation before opening a position.
To trade using the bullish rectangle chart pattern, traders can use the following method:
- Ensure and confirm that there is a strong bullish trend
- Spot the formation of the pattern and draw horizontal lines to identify it
- Take a long position once the bullish candlesticks have closed above the resistance level once the break has ended.
- Alternatively, traders can open their long position after the price retest on the resistance level following the breakout.
- Traders must set their stop-loss just below their entry point below the next low.
- To determine where the take profit must be placed, traders can measure the distance between the support and resistance line or the height of the rectangle and project the same distance upwards after the breakout has occurred from the resistance level.
- This means that traders' take profit orders from the entry point must be equal to the distance which exists between the support and resistance line of the triangle.